

Réalisation du site Web : Juliette Fabre
Dernière modification 17-05-2024
Copyright © INRA
Mentions légales

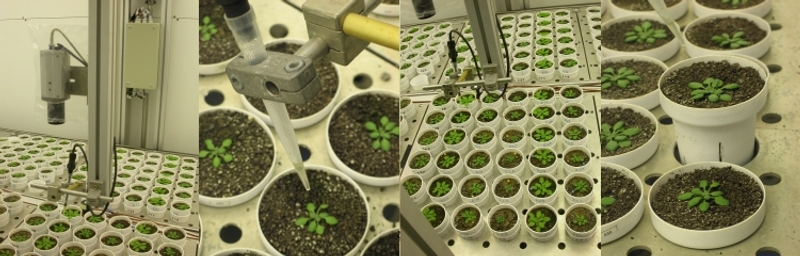
LE SYSTEME PHENOPSIS
Platform improvements : Thermal imaging in Phenopsis [June, 2013]
Thermal images of individual plants are now acquired and analyzed at high throughput on large populations.
Rosette temperature can be used routinely as a covariate in mixed-effect models dedicated to QTL detection.
New references with results from the Phenopsis platform [June, 2013]
- Pantin F. 2011. Control of leaf expansion: a developmental switch from metabolics to hydraulics. Plant Physiol. 156(2):803-815
- Vile D. et al. 2012. Arabidopsis growth under prolonged high temperature and water deficit: independent or interactive effects? Plant Cell and Environment 35(4): 702-718.
- Wuyts N et al. 2012. Structural assessment of the impact of environmental constraints on Arabidopsis leaf growth: a 3D approach. Plant Cell and Environment 35(9):1631-1646.
- Vasseur F etal. 2012. A common genetic basis to the origin of the leaf economics spectrum and metabolic scaling allometry. Ecology Letters 15(10):1149-1157.
- Baerenfaller K et al. 2012. Systems-based analysis of Arabidopsis leaf growth reveals adaptation to water deficit. Molecular Systems Biology 8: 606.
- Lièvre M et al. 2013. Phenotyping the kinematics of leaf development in flowering plants: recommendations and pitfalls. WIREs Dev Biol 2013. doi: 10.1002/wdev.119.
Platform improvements : Fluoresence facilities [June, 2013]

Imaging Pam in PHENOPSIS
A fluorescence imaging system (Imaging Pam) is now embarked on the moving arm of the PHENOPSIS phenotyping platform.
A wide range of photosynthesis parameters are extracted from the automatic measurements of chlorophyll fluorescence, giving an overview of physiological state of plants.
Specific applications have been developed thanks to our collaboration with Optimalog, Walz and the Juelich Plant Phenotyping Center.
These developments were funded by the KIC-Climate FP7 project, AgWaterBreed.
Platform improvements [June, 2013]
Growing and phenotyping canola in PHENOPSIS:
One robot (among the 3) has been adapted to analyze the genetic variability of canola development and functioning in response to drought stress.
This evolution has been performed in the frame of the KIC Climate project AgWaterBreed funded by the 7th European framework program for 3 years (2010-2013).

Growing and phenotyping canola in PHENOPSIS

Shoot development of canola as affected by soil humidity
Humidity levels are shown on pots
Integrating plant phenotyping efforts in coordinated networks[May, 2012]
PHENOPSIS is part of the Phenome and EPPN projects; French and European networks of plant high-throughput phenotyping platforms.
Follow the links below for more information :
http://www.bulletins-electroniques.com/actualites/69931.htm
http://www.plant-phenotyping-network.eu/eppn/home
New references with results from the Phenopsis platform [Feb 23, 2011]
- Massonnet C, et al (2010) Probing the reproducibility of leaf growth and molecular phenotypes: a comparison of three Arabidopsis accessions cultivated in ten laboratories Plant Physiology 152, 2142-2157.
- Tisné S, et al (2010) Keep on growing under drought : genetic and developmental bases of the response of rosette area using a recombinant inbred line population. Plant Cell & Environment 33: 1875-1887.
- Hummel I, et al (2010) Arabidopsis thaliana plants acclimate to water deficit at low cost through changes of C usage; an integrated perspective using growth, metabolite, enzyme and gene expression analysis. Plant Physiol. 154(1):357-372.
- Aubert Y, et al (2010) RD20, a stress-inducible caleosin, participates in stomatal control, transpiration and drought tolerance in Arabidopsis thaliana. Plant Cell Physiol. 51(12):1975-1987.
Platform improvements [Feb 23, 2011]
The PHENOPSIS platform has been improved by the addition of an additional camera (side view camera) to take lateral pictures of the plants. This allows measurements of leaf angles and corrections of the surface area measured on images issued from the vertical camera, when necessary (hyponasty caused by environmental stresses or different mutants).
- François Vasseur et al. 2011, Changes in light intensity reveal a major role for carbon balance in Arabidopsis responses to high temperature. Plant Cell Environ. 34(9):1563-1576.

The Information system is available [Feb 23, 2011]
The PHENOPSIS_DB information system is now publicly available. Data and images stored in the database can be visualized and downloaded.
Server architecture
The PHENOPSIS database is located on the Montpellier-Supagro campus Informatic Unit server. The file names referenced in the database (images, protocols, scans, ..) are stored in an organised way on this server.
The Web interface PHENOPSIS DB (PHP, XHTML, JavaScript and Ajax scripts) is also stored on the server, as well as the R scripts used for data insertion and checking, data structuration and data analysis or visualisation, and the ImageJ macros called for online image analysis.
Automatic data transfer
The soil humidity data collected by the automatons are inserted in the database in real time via automated SQL requests. By the same way, images taken by the automatons are automatically transferred in real time on the server. Finally, meteorological data are automatically inserted in the database several times a day.
Out-of-line data and metadata insertion
Measurements on plants are manually recorded into Excel files. These Excel files are converted by users into CSV files following strict rules on data format as defined in a PDF document.
Users with authorization can upload these CSV data files via the Web interface to insert the corresponding data into the database.
Metadata (experiment, pot, genotype or variable features, comments, etc) are inserted via the PHENOPSIS DB Web interface either record by record via insertion forms, or by uploading CSV datasets files on the Web interface.